Short Answer
Introduction
Palo Alto, a centerpiece of Silicon Valley, is known for its tech innovation, high‑density employment centers, and a strong commitment to sustainable mobility. The city’s transportation network intertwines regional rail (Caltrain), a municipal bus system, an extensive road hierarchy, and a growing infrastructure for cyclists and pedestrians. Understanding how these modes interact is essential for planners, residents, and visitors alike.
Table of Contents
Overview
Palo Alto’s transportation system can be divided into five interrelated components:
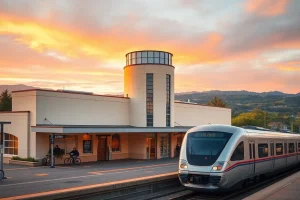
- Rail: Caltrain provides north‑south regional service between San Francisco and San Jose, with a major station at 7th & University.
- Roads: A grid of arterial streets (e.g., El Camino Real, University Avenue) connects to State Route 84 (the Woodside‑Palo Alto interchange) and Interstate 280.
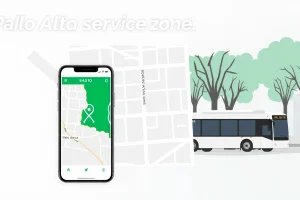
- Buses: The city operates the Palo Alto Shuttle (formerly the GGT) and contracts with SamTrans for broader coverage.
- Cycling: Over 30 mi of protected bike lanes, bike‑share stations, and a city‑wide bike‑parking policy.
- Walking: Compact mixed‑use neighborhoods, a network of sidewalks, and the Streets for People initiative.
According to the City of Palo Alto Transportation Master Plan (2022), more than 55 % of trips are made by walking, cycling, or transit, a figure that surpasses the national average of 38 % (U.S. Census, 2021).
Key Concepts
Multimodal Integration
Multimodal integration refers to the seamless connection between different transport modes—rail, bus, bike, and foot—through coordinated schedules, shared ticketing, and physical infrastructure such as transit hubs.
Complete Streets
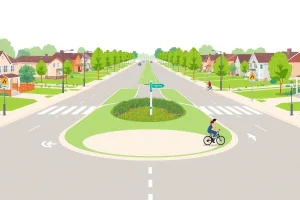
The Complete Streets policy adopted in 2015 requires that any new street design accommodate all users at safe speeds, balancing vehicle throughput with pedestrian and cyclist needs.
Transit‑Oriented Development (TOD)
TOD concentrates housing, jobs, and amenities within a half‑mile radius of a transit station. Palo Alto’s University Station TOD includes 1,200 new housing units, 150,000 sq ft of office space, and 20 percent affordable housing.
First‑/Last‑Mile Solutions
First‑/last‑mile gaps are addressed through bike‑share (e.g., Bay Wheels), micro‑mobility scooters, and on‑demand shuttle services that connect neighborhoods to major transit nodes.
Benefits
Environmental Impact
Transportation accounts for roughly 30 % of Palo Alto’s greenhouse‑gas emissions (Palo Alto Climate Action Plan, 2023). Shifting 10 % of car trips to transit or active modes could cut emissions by 1,200 metric tons CO₂ annually.
Economic Productivity
The 2021 Caltrain ridership report shows an average weekday boardings of 13,500, supporting an estimated $1.2 billion in regional economic activity. Reduced congestion also shortens commute times, saving an average of 12 minutes per driver.
Public Health
Active transportation correlates with lower obesity rates. A Stanford Health study (2022) found that Palo Alto residents who bike or walk daily have a 22 % reduced risk of cardiovascular disease compared with car‑only commuters.
Challenges
Congestion on El Camino Real
El Camino Real carries an average daily traffic (ADT) of 45,000 vehicles, exceeding its designed capacity by 20 %. Peak‑hour speeds have dropped to 12 mph, leading to a 15 % increase in travel time over the past five years.
Parking Constraints
The city’s parking inventory is limited to 5,200 spaces, with a 95 % occupancy rate during weekdays. High parking fees (average $2.50/hr) discourage new development and contribute to spillover parking in residential streets.
Equity Gaps
Neighborhoods such as Mayfield lack direct Caltrain access, resulting in a 30 % higher car‑ownership rate than the city average (Palo Alto Equity in Mobility Report, 2022).
Funding Uncertainty
State and federal transit funding has fluctuated, with Caltrain’s 2024 budget reduced by $15 million, jeopardizing planned electric‑train upgrades.
Best Practices
Policy Coordination
Align the City’s General Plan with the Regional Transportation Plan (SFMTA) to ensure consistent funding streams and design standards.
Data‑Driven Planning
Utilize the City’s Open Data portal (traffic counts, bike‑share usage) to model demand and prioritize interventions.
Community Engagement
Host quarterly “Mobility Forums” that include residents, business owners, and university representatives to co‑design solutions.
Infrastructure Prioritization
Implement the “Three‑E” framework: Equity, Efficiency, Environment. Projects are scored on these criteria before funding allocation.
“Palo Alto’s success lies in treating transportation as a public health issue, not just a traffic problem,” says Dr. Maya Patel, Professor of Urban Planning at Stanford University.
Tools & Resources
Data Platforms
- Palo Alto Open Data Portal – real‑time traffic, bike‑share, and parking data.
- Caltrain Ridership Dashboard – monthly boarding figures and on‑time performance.
Planning Documents
- Transportation Master Plan (2022)
- Complete Streets Ordinance (2015)
- Climate Action Plan (2023)
Mobile Apps
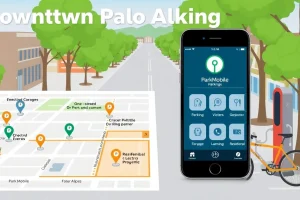
- Transit – real‑time bus and Caltrain schedules.
- Bay Wheels – bike‑share availability and docking station locations.
Future Trends
Electrified Rail
Caltrain is transitioning to a fully electric fleet by 2030, reducing local emissions by 90 % per train‑mile.
Smart Traffic Management
Adaptive signal control technology (ASCT) will be installed at the 12 busiest intersections, aiming to cut delay by 20 %.
Micromobility Integration
Shared e‑scooters are slated for a pilot program in the Downtown area, with designated curb zones to protect pedestrians.
Vision Zero Initiatives
The city’s Vision Zero goal targets zero traffic fatalities by 2035, employing speed‑reduction measures, enhanced crosswalk lighting, and data‑driven enforcement.
Conclusion
Palo Alto’s transportation ecosystem exemplifies how a mid‑size, high‑tech city can balance growth with sustainability. By leveraging multimodal integration, data‑driven policies, and community‑focused design, the city not only eases congestion but also improves public health and environmental outcomes. Continued investment in electrified rail, smart traffic systems, and equity‑centric planning will be critical to maintaining this trajectory.
FAQ
What are the main public transportation options in Palo Alto?
The main options are Caltrain for regional rail service, SamTrans and the Palo Alto Shuttle for bus services, and Bay Wheels bike-share for first-/last-mile connections.
How does Palo Alto support cycling and walking?
The city has over 30 miles of protected bike lanes, a bike-share program, a Complete Streets policy that requires safe designs for all users, and the Streets for People initiative to enhance pedestrian spaces.
What is the biggest transportation challenge in Palo Alto?
Congestion on El Camino Real is a major issue, with average daily traffic exceeding designed capacity by 20% and peak-hour speeds dropping to 12 mph.
What is Palo Alto's Vision Zero goal?
Vision Zero aims to eliminate all traffic fatalities and severe injuries by 2035 through speed reduction, improved crosswalks, and data-driven enforcement.
How is Caltrain being improved?
Caltrain is transitioning to a fully electric fleet by 2030, which will reduce local emissions by 90% per train-mile and improve service frequency.
Leave a Reply