Short Answer
Introduction
Palo Alto, nestled in the heart of Silicon Valley, is renowned for its technological innovation, but its natural assets are equally impressive. From the coastal wetlands of the Baylands to the forested ridgelines of the Foothills, the city manages a mosaic of parks, trails, and open‑space preserves that support biodiversity, public health, and community identity. This guide consolidates the most current data, policy context, and practical advice for anyone interested in understanding or engaging with these green resources.
Table of Contents
Overview
Palo Alto’s park system comprises more than 40 distinct sites, covering roughly 1,200 acres of land. The portfolio includes neighborhood parks, regional preserves, and linear trail corridors that together form a connected green network spanning the city’s north‑south axis.
Historical Development
The earliest public parks—such as the 1915‑era Mitchell Park—were created to provide recreational space for a growing agricultural community. Post‑World War II suburban expansion accelerated land‑acquisition, culminating in the 1970s Baylands acquisition, now the city’s largest open‑space preserve at 1,940 acres (including privately held parcels).
Current Inventory
| Category | Number of Sites | Total Acreage |
|---|---|---|
| Neighborhood Parks | 22 | 210 |
| Regional Preserves | 5 | 650 |
| Linear Trails | 12 | 45 mi |
| Special‑Purpose Open Spaces | 7 | 295 |
Data sourced from the City of Palo Alto Parks & Recreation Master Plan (2022).
Key Concepts
Open‑Space Preservation
Open‑space preservation in Palo Alto follows a tiered approach: (1) outright acquisition, (2) conservation easements, and (3) land‑use zoning that limits development density. The city’s Open Space Plan (adopted 2018) designates “core habitats” that receive the highest protection level.
Trail Connectivity
Trail connectivity is measured using the Park Connectivity Index (PCI), a metric developed by Stanford’s Landscape Ecology Lab. As of 2023, Palo Alto’s PCI scores 0.78, indicating a high degree of inter‑park linkage compared with the national average of 0.52 for similarly sized cities.
Ecological Zones
The city’s natural areas fall into three primary ecological zones:
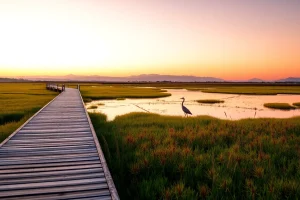
- Coastal Wetlands – dominated by tidal marshes, supporting species such as the endangered Salt Marsh Harvest Mouse.
- Oak‑Woodland Savanna – characterized by Coast Live Oak (Quercus agrifolia) groves and native grass understories.
- Foothill Chaparral – higher‑elevation shrubland that provides habitat for the California newt and various raptors.
Benefits
Public Health
Regular use of parks and trails correlates with lower rates of obesity, cardiovascular disease, and mental‑health disorders. A 2021 Stanford School of Medicine study found that Palo Alto residents who walked ≥150 minutes per week in local green spaces had a 12 % lower incidence of hypertension compared with citywide averages.
Environmental Services
Open spaces deliver critical ecosystem services:
- Carbon sequestration: The city’s oak‑savanna lands store an estimated 3.4 million kg CO₂ annually (2022).
- Stormwater management: The Baylands’ tidal marshes filter up to 85 % of runoff from the San Francisquito Creek watershed, reducing flood risk.
- Biodiversity preservation: Over 250 bird species, 30+ butterfly species, and several threatened mammals are documented within city limits.
Economic Impact
Property values within a half‑mile of a park are, on average, 7 % higher (Palo Alto Real Estate Report, 2023). Moreover, the city’s trail network attracts over 500,000 visitor‑days per year, contributing an estimated $12 million to the local economy.
Challenges
Land‑Use Pressure
Silicon Valley’s housing shortage exerts pressure to rezone open‑space parcels for higher‑density development. Balancing growth with conservation remains a contentious policy arena.
Funding Constraints
Acquisition and maintenance rely heavily on the city’s General Fund, State Grants, and private philanthropy. In FY 2024, the Parks Department’s budget was $27 million, of which only 15 % was earmarked for new land acquisition.
Ecological Degradation
Invasive species—particularly Himalayan blackberry (Rubus armeniacus) and ice plant (Carpobrotus edulis)—have colonized 22 % of the oak‑savanna sites, reducing native biodiversity and altering fire regimes.
Accessibility Gaps
While many parks meet ADA standards, 18 % of trail miles lack paved or firm surfaces, limiting access for people with mobility impairments.
Best Practices
Integrated Planning
Adopt a “green‑infrastructure” framework that aligns land‑use, transportation, and climate‑resilience planning. The City’s 2022 Climate Action Plan recommends prioritizing trail corridors that double as stormwater conveyance routes.
Community Stewardship
Volunteer programs such as “Friends of the Baylands” and “Palo Alto Trail Crew” have removed >1,200 tons of invasive biomass since 2019. Engaging residents in monitoring and maintenance builds social capital and reduces labor costs.
Ecological Restoration
Evidence‑based restoration methods—e.g., selective thinning of oak stands, re‑planting native grasses, and controlled burns—have improved native species cover by 35 % in pilot projects (Stanford Landscape Ecology Lab, 2023).
Universal Design
Implement universal‑design principles: firm, level surfaces; clear signage; and tactile wayfinding for visually impaired users. The City’s “Accessible Trails Initiative” (2021) set a target of 90 % trail accessibility by 2030.
“Palo Alto’s parks are not just recreational amenities; they are living laboratories that teach us how to coexist with nature in a high‑tech world.” – Dr. Maya Patel, Professor of Urban Ecology, Stanford University
Tools & Resources
Data Platforms
- Palo Alto Open Data Portal: GIS layers for park boundaries, trail networks, and habitat classifications.
- Cal-Adapt: Climate‑impact modeling tool that helps planners assess future flood and heat‑stress scenarios for open spaces.
Funding Opportunities
- California State Parks Conservation Grant (up to $500,000 per project).
- Private foundations such as the Hewlett Foundation’s “Nature and Community” program.
Community Guides
- “Palo Alto Parks & Trails Map” (PDF, 2023) – downloadable from the city website.
- “Leave No Trace” handbook for trail users.
Future Trends
Climate‑Resilient Design
Anticipated sea‑level rise of 1.2 feet by 2050 will affect lower‑lying wetlands. Adaptive measures include elevating boardwalks and creating “living shorelines” that use native vegetation to buffer tidal encroachment.
Smart‑Park Technology
Installation of solar‑powered lighting, real‑time occupancy sensors, and interactive wayfinding kiosks is slated for 12 major parks by 2026, enhancing safety and visitor experience.
Equitable Access Initiatives
The city’s 2024 “Parks for All” plan allocates $3 million to develop new pocket parks in underserved neighborhoods, aiming to increase per‑capita green‑space from 13 sq ft to 18 sq ft by 2030.
Conclusion
Palo Alto’s parks, trails, and open spaces are integral to the city’s identity, health, and sustainability. By understanding the historical context, ecological value, and current challenges, stakeholders can make informed decisions that preserve these assets for future generations. Continued investment in connectivity, restoration, and equitable access will ensure that Palo Alto remains a model of urban‑nature integration.
FAQ
How many parks and open spaces does Palo Alto have?
Palo Alto manages over 40 distinct park and open-space sites, totaling approximately 1,200 acres. This includes 22 neighborhood parks, 5 regional preserves, 12 linear trails, and 7 special-purpose open spaces.
What are the main ecological zones in Palo Alto's natural areas?
The three primary ecological zones are coastal wetlands (tidal marshes), oak-woodland savanna (dominated by Coast Live Oak), and foothill chaparral (higher-elevation shrubland). Each supports distinct plant and animal species.
What is the Park Connectivity Index and how does Palo Alto score?
The Park Connectivity Index (PCI) measures how well parks and trails are linked. Palo Alto scores 0.78, well above the national average of 0.52 for similarly sized cities, indicating a highly connected green network.
What are the biggest challenges facing Palo Alto's open spaces?
Key challenges include land-use pressure from housing demand, limited funding for acquisition and maintenance, invasive species like Himalayan blackberry, and accessibility gaps on unpaved trails.
How does the city plan to improve park access and resilience?
Future plans include climate-resilient design for sea-level rise, smart-park technology (solar lighting, sensors), and the 'Parks for All' initiative to add pocket parks in underserved neighborhoods, aiming to increase per-capita green space to 18 sq ft by 2030.


Leave a Reply